What's inside
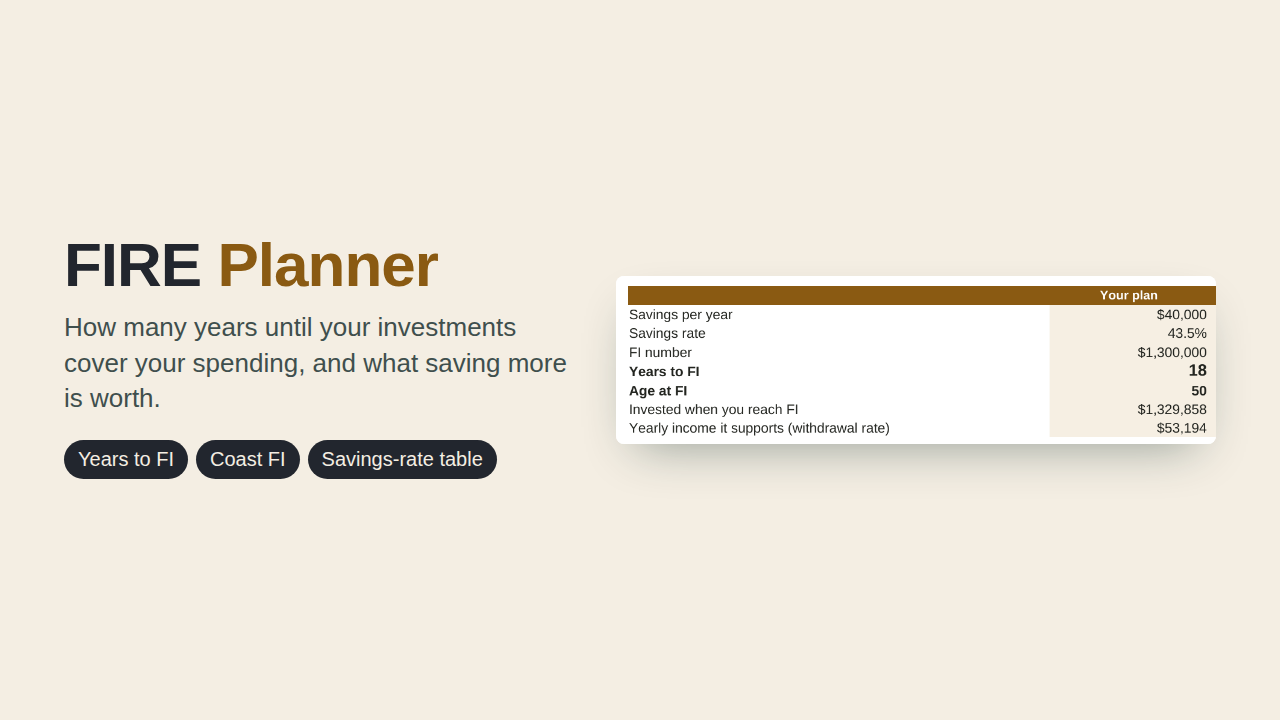
- Your FI number (spending ÷ a safe withdrawal rate) and the years and age at which you reach it
- A "what if I saved more" column side by side with your plan
- Coast FI: how much you'd need invested today for growth alone to reach your FI number by a normal retirement age
- A 60-year projection that stops saving and withdraws your spending once you reach FI, with a chart
- The classic table: years to FI at savings rates from 5% to 75% of your pay, starting from what you have today
- Everything in today's dollars, using a return after inflation you choose
- Sample file: age 32, $85,000 invested, $92,000 take-home, $52,000 spending. FI number $1,300,000 in 18 years (age 50); saving $5,000 more a year gets there a year sooner
Checked, not just designed: 464 formulas, zero errors, and years to FI, the full projection, coast FI and every row of the savings-rate table were checked against an independent year-by-year simulation in 7 scenarios, including 0% and negative returns.
Works in Excel and Google Sheets. Projections from your assumptions, not predictions or financial advice.
Try the free version first
The free online calculator uses the same model for a quick answer. The spreadsheet adds tracking, history and the full views.