What's inside
- A 360-month model: mortgage (principal and interest), PMI until you reach 80%, property tax, insurance, HOA, maintenance, home value growth and selling costs
- Renting: rent with yearly increases and renters insurance
- A fair comparison: the renter invests the down payment and closing costs, and every month the cheaper side invests the difference
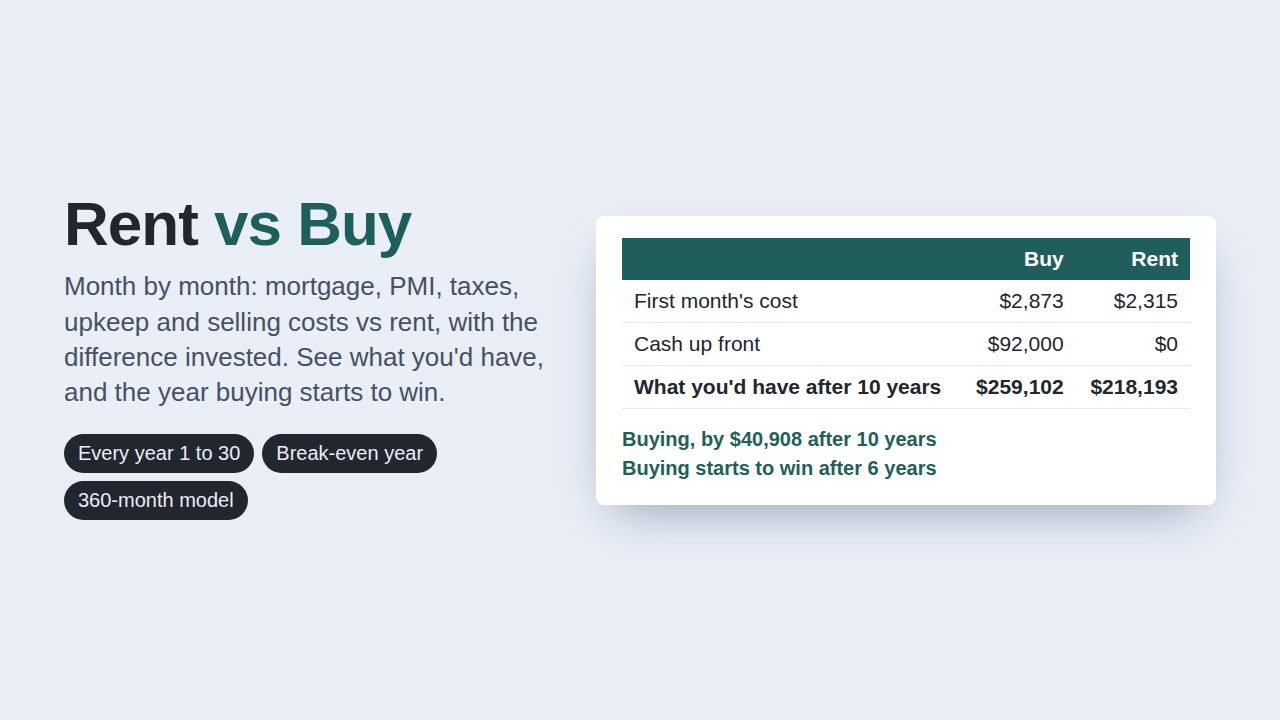
- The first year buying comes out ahead, what you'd have for every year from 1 to 30, and a chart
- Sample file: a $400,000 home with 20% down at 6.5% vs $2,300 rent. Buying pulls ahead in year 6 and is $40,908 ahead after 10 years
Checked, not just designed: 5,883 formulas, zero errors, and every figure was simulated independently month by month in 9 scenarios per file (PMI, falling prices, a paid-off loan, 0% rate and more). All matched to the cent.
Works in Excel and Google Sheets. A calculator, not financial advice.
Try the free version first
The free online calculator uses the same model for a quick answer. The spreadsheet adds tracking, history and the full views.