What's inside
- Properties tab for up to 10 properties: price, down payment, closing and rehab costs, loan. The monthly mortgage payment (P&I) is calculated for you
- Transactions log with property and category dropdowns (rent, late fees, taxes, insurance, repairs, HOA, management, mortgage, capital improvements…)
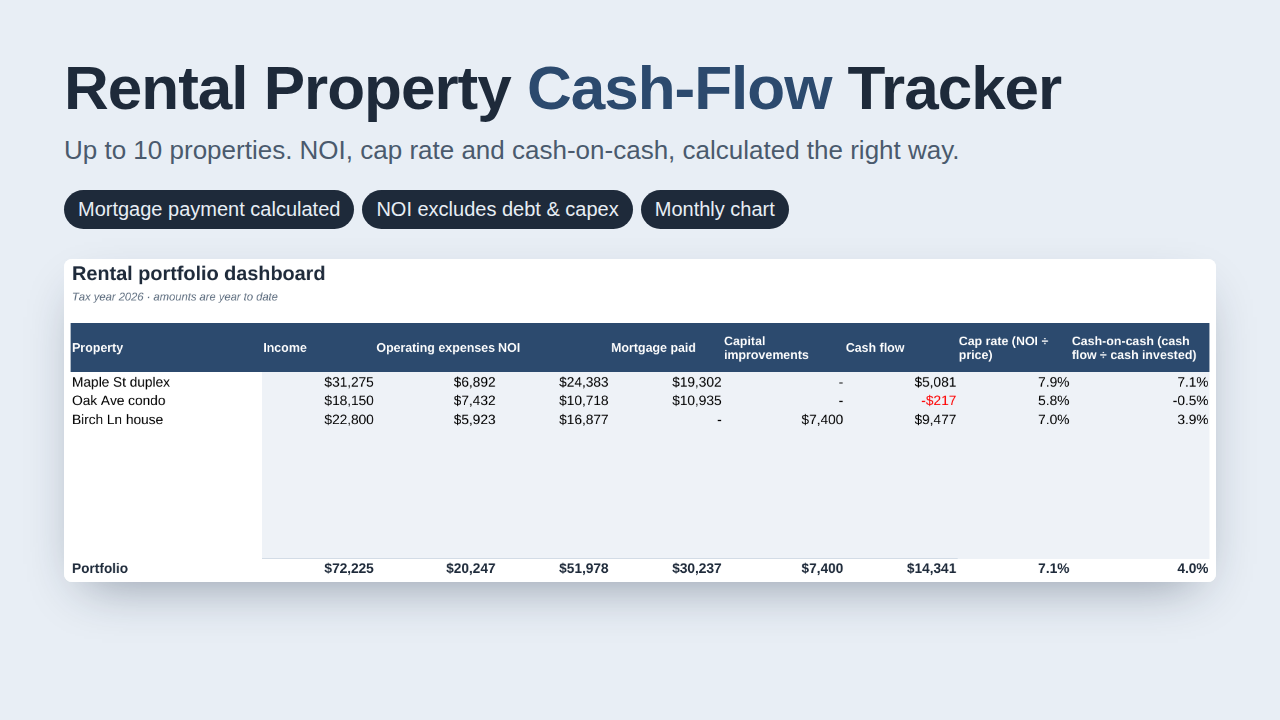
- Dashboard per property and for the portfolio: income, operating expenses, NOI, mortgage paid, capital improvements, cash flow, cap rate, cash-on-cash; plus a month-by-month table and chart
- Calculated the right way: mortgage payments and capital improvements reduce cash flow but are not operating expenses, so they don't distort NOI or cap rate
- Warnings for transactions with no property, and a check that monthly totals match the property totals
- Sample file: a financed duplex, a condo with HOA fees and a vacant month (it loses money, and the dashboard shows it), and a paid-off house with a new roof
Checked: zero formula errors; every sample result and mortgage payment matched an independent calculation.
Works in Excel and Google Sheets with standard functions. Not tax or investment advice.
Try the free version first
The free online calculator uses the same model for a quick answer. The spreadsheet adds tracking, history and the full views.